Weather Influences on Seasonal Leaderboards Across Major Outdoor Leagues
Mara Richter · May 29, 2026
Weather Influences on Seasonal Leaderboards Across Major Outdoor Leagues
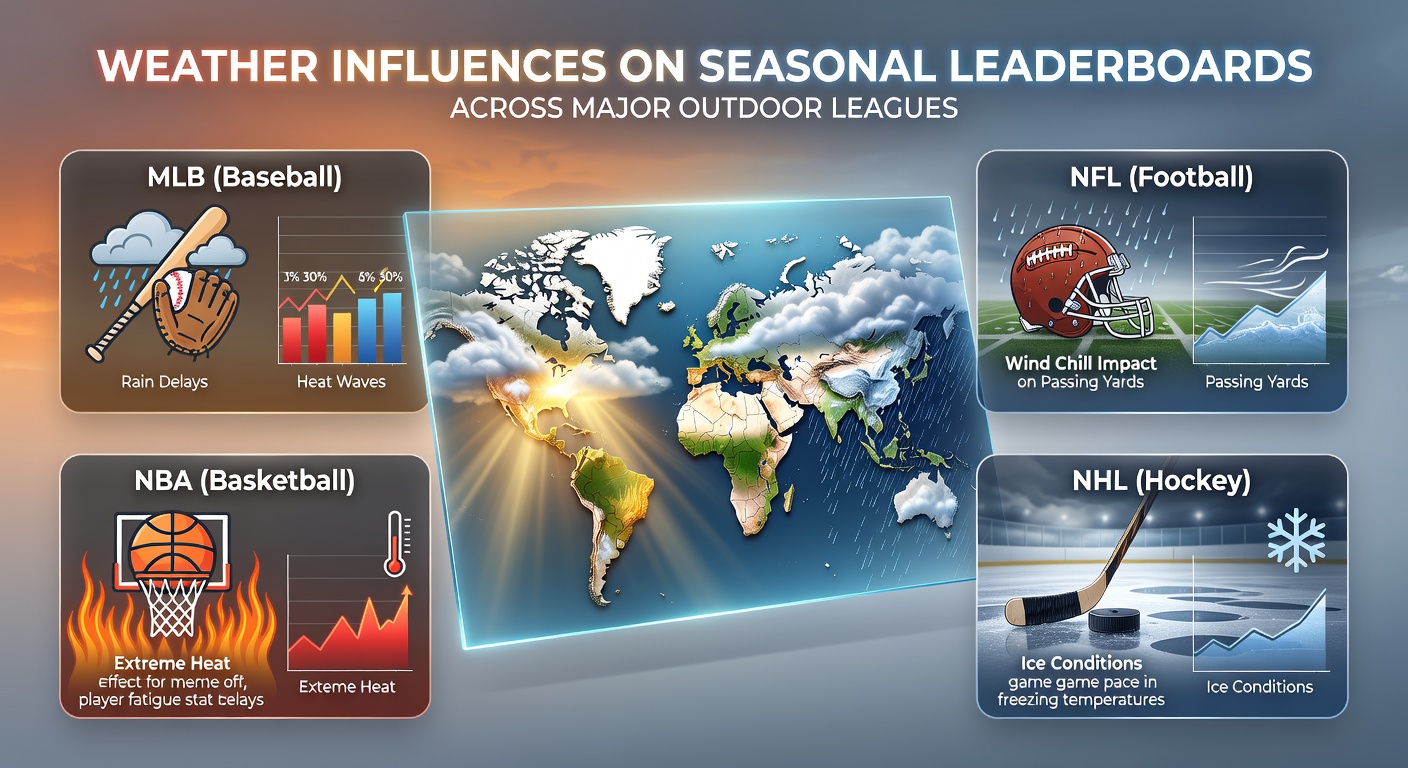
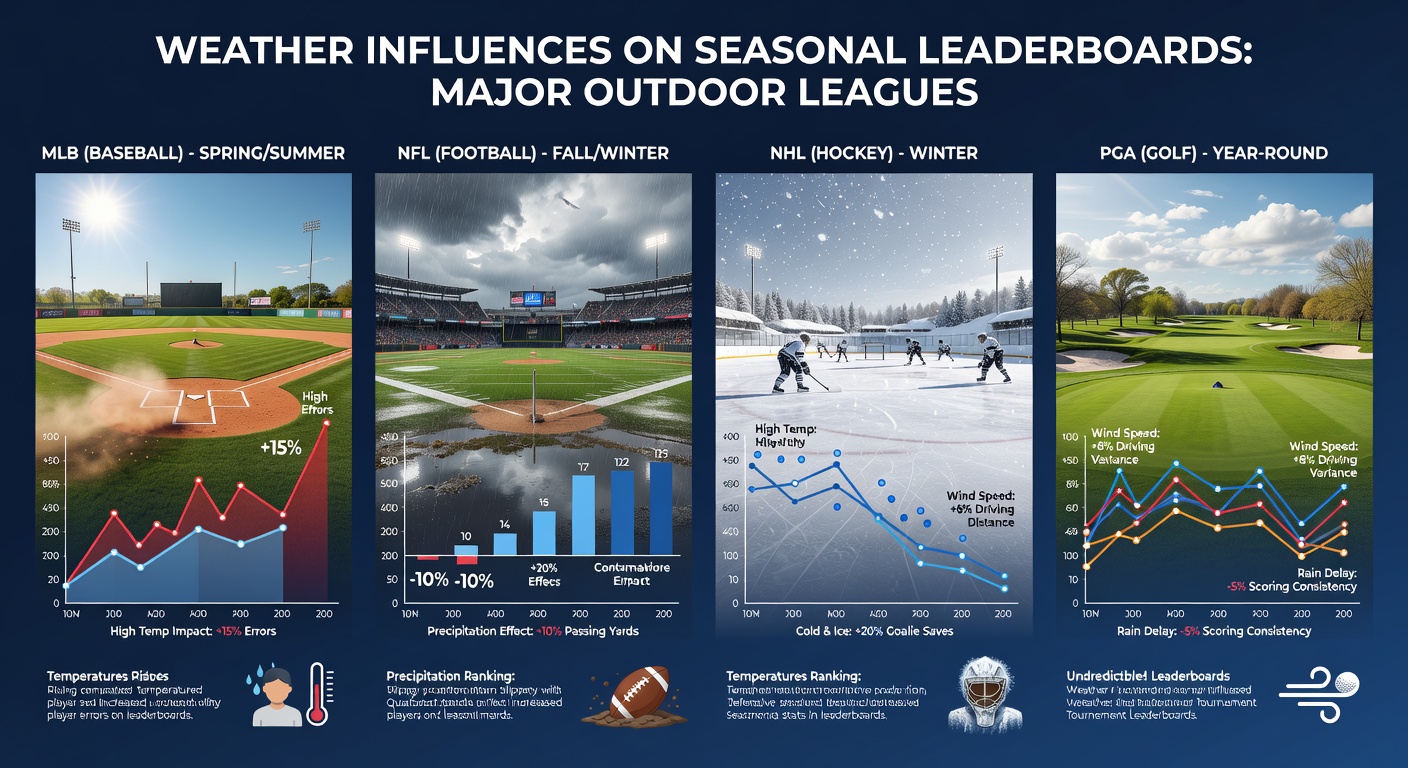
Weather conditions exert measurable effects on performance metrics that determine seasonal leaderboards in outdoor sports, and researchers have documented these patterns through decades of data collection across multiple leagues. Temperature shifts alter player endurance and ball flight characteristics while precipitation changes field surfaces and equipment behavior in ways that influence passing accuracy in the NFL and batting averages in MLB. Wind patterns further modify trajectories in soccer matches and tennis rallies, creating statistical variations that appear consistently in league records.
Baseball and Atmospheric Variables
MLB statisticians track how humidity levels and air density correlate with home run totals during different months of the season, and data from the National Oceanic and Atmospheric Administration shows that lower air density in warmer months allows balls to travel farther on average. Pitchers experience changes in grip and movement during high-humidity games, which contributes to elevated earned run averages in certain stadiums located in coastal regions. Observers note that these environmental factors produce repeatable shifts in player rankings from April through September, particularly for power hitters who accumulate extra bases when playing in thinner air at higher elevations.
Football Performance Under Changing Conditions
NFL teams compile passing and rushing statistics that reflect adaptations to rain, snow, and temperature extremes across the regular season and playoffs. Cold weather reduces ball grip for quarterbacks and wide receivers while also affecting traction for running backs, and historical records indicate lower completion percentages during games played below freezing temperatures. League data compiled over multiple decades demonstrates that outdoor venues in northern markets record higher fumble rates during late-season contests when field conditions deteriorate due to precipitation and frost.
Soccer and Pitch Conditions
European soccer leagues such as the Premier League and Bundesliga publish goal and assist totals that vary with rainfall amounts because waterlogged pitches slow ball speed and increase the difficulty of precise passing sequences. Midfielders accumulate fewer completed passes per match in wet conditions according to tracking systems employed by professional clubs, while defenders record higher tackle success rates when surfaces become slick. Analysts reviewing match logs from the past twenty years identify clear seasonal patterns where teams in rainy climates post different goal differentials during winter months compared to drier spring schedules.
Tennis Rankings and Outdoor Court Play
ATP and WTA outdoor tournaments experience ranking point distributions that shift when rain delays interrupt play or when wind affects serve speeds and baseline rallies. Hard and clay courts respond differently to moisture, with clay surfaces becoming heavier and slower after precipitation while hard courts maintain more consistent bounce until heavy rain forces postponements. Tournament data collected across Grand Slam events and Masters 1000 series reveals that players with stronger return games often improve their win percentages in windy conditions because opponents struggle with serve placement.
Cross-League Patterns in Spring 2026
During May 2026 several outdoor leagues simultaneously encountered elevated temperatures and scattered thunderstorms that altered mid-season leaderboards in comparable ways. MLB teams playing in the American League East posted adjusted slugging percentages when facing humid nights, while concurrent UEFA Champions League knockout matches showed reduced goal tallies on rain-slicked pitches. These overlapping weather events produced leaderboard movements that statisticians could trace directly to environmental measurements rather than roster changes alone.
Data Collection and Predictive Models
League offices and independent research groups employ weather stations at venues to correlate specific conditions with performance outcomes, and studies published by institutions such as the University of Exeter have quantified how wind speed above fifteen kilometers per hour reduces passing completion rates in soccer by measurable margins. Similar modeling applied to MLB demonstrates that a five-degree Celsius temperature increase typically corresponds to a three to five percent rise in fly ball distance. Organizations maintain these datasets to refine scheduling decisions and injury prevention protocols during periods of extreme heat or cold.
Conclusion
Weather continues to function as a consistent variable that shapes the numerical outcomes compiled into seasonal leaderboards across NFL, MLB, soccer, and tennis competitions. Teams and players adapt through equipment choices and tactical adjustments, yet the underlying statistical effects remain visible in league archives and performance tracking systems. Continued monitoring by meteorological agencies and sports organizations provides the factual basis for understanding these influences without speculation about future trends.