The Ripple Effect of Refereeing Trends on Statistical Inflation Across Soccer, Basketball, Football, and Baseball Leagues
Cameron Otto · Aug 12, 2026
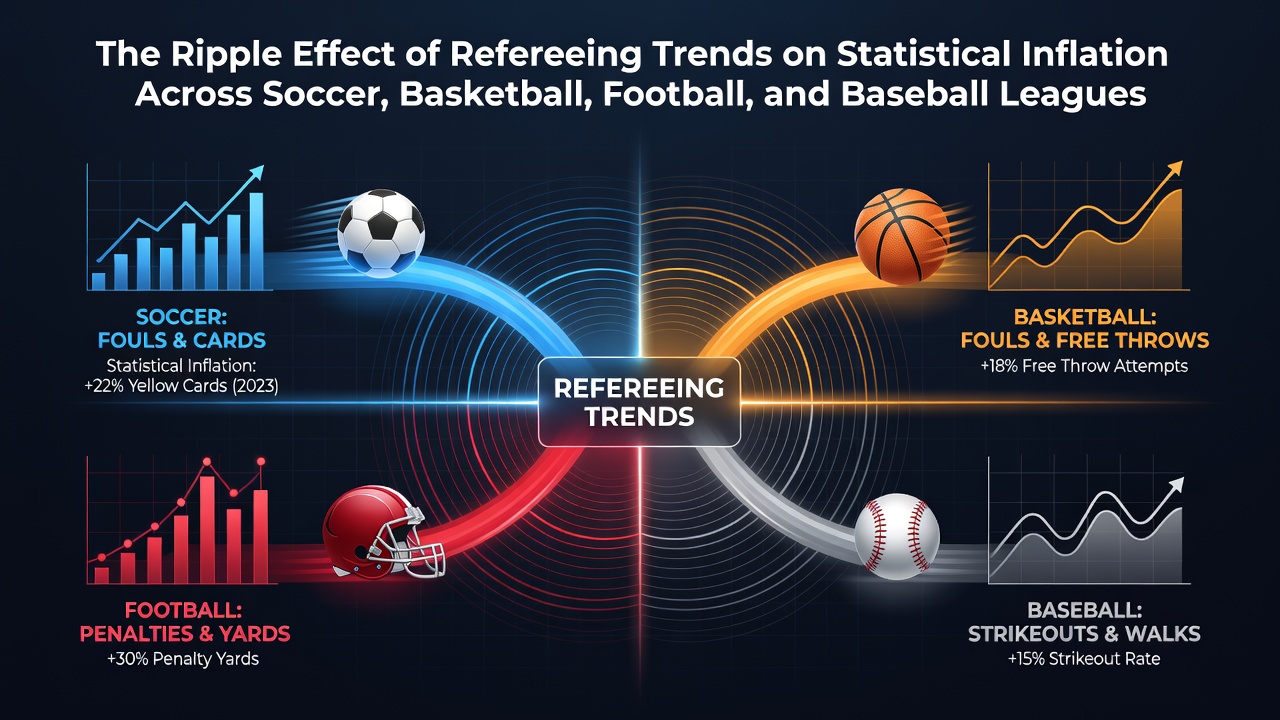
The Ripple Effect of Refereeing Trends on Statistical Inflation Across Soccer, Basketball, Football, and Baseball Leagues
Refereeing adjustments in major leagues have coincided with measurable shifts in player and team statistics over recent seasons, and data from 2024 through August 2026 shows continued patterns in scoring, penalties, and efficiency metrics across soccer, basketball, football, and baseball. These changes stem from modifications in enforcement emphasis, technology integration, and rule interpretations that alter how games unfold on the field, court, or diamond.
Soccer's VAR and Foul Call Patterns
European soccer competitions introduced expanded video assistant referee protocols after 2018, and subsequent seasons recorded increases in awarded penalties and stoppage time additions that extended game durations by several minutes on average. UEFA match reports indicate penalty kick attempts rose in certain domestic leagues between 2022 and 2025, correlating with higher goal totals in matches where video reviews occurred multiple times. In the Premier League and La Liga, free kick counts near the box climbed as officials applied stricter interpretations of contact in the penalty area, which produced more set-piece opportunities and associated scoring attempts.
Observers tracking Serie A and Bundesliga data note similar trends, where yellow card distributions shifted toward defensive players and contributed to altered possession percentages after stoppages. These adjustments ripple into player-level stats such as expected goals and assists, because additional minutes of play allow for extra passes and shots that accumulate over a 38-match schedule.
Basketball Foul Trends and Scoring Volume
NBA officiating crews adjusted emphasis on perimeter contact starting in the 2023-24 season, and league-wide free throw attempts per game increased modestly while three-point attempt rates continued their upward trajectory through the 2025-26 campaign. Tracking data compiled by the league shows that games with higher foul differentials often featured elevated scoring margins in the final quarters, as teams capitalized on bonus situations. Point guard and wing player stat lines reflect these shifts, with assist and steal numbers rising in contests that featured frequent whistle stops.
College conferences aligned with similar directives from the NCAA rules committee, and box scores from the 2025-26 season reveal parallel growth in field goal attempts per possession. The pattern holds across both professional and amateur levels because consistent enforcement of hand-checking and screen-setting rules creates more open driving lanes that translate into higher efficiency numbers for perimeter-oriented offenses.
Football Penalty Enforcement and Yardage Totals
NFL rule emphasis on defensive contact below the waist and helmet-to-helmet standards produced measurable changes in penalty yardage from 2022 onward, and 2025 regular-season averages showed defensive holding and pass interference flags contributing additional first downs per contest. Teams with high-volume passing attacks recorded inflated completion percentages in part because fewer contested catches resulted in penalties that reset the down-and-distance equation. Running back and wide receiver cumulative stats reflect these outcomes through extended drives that generate extra rushing attempts and receptions.
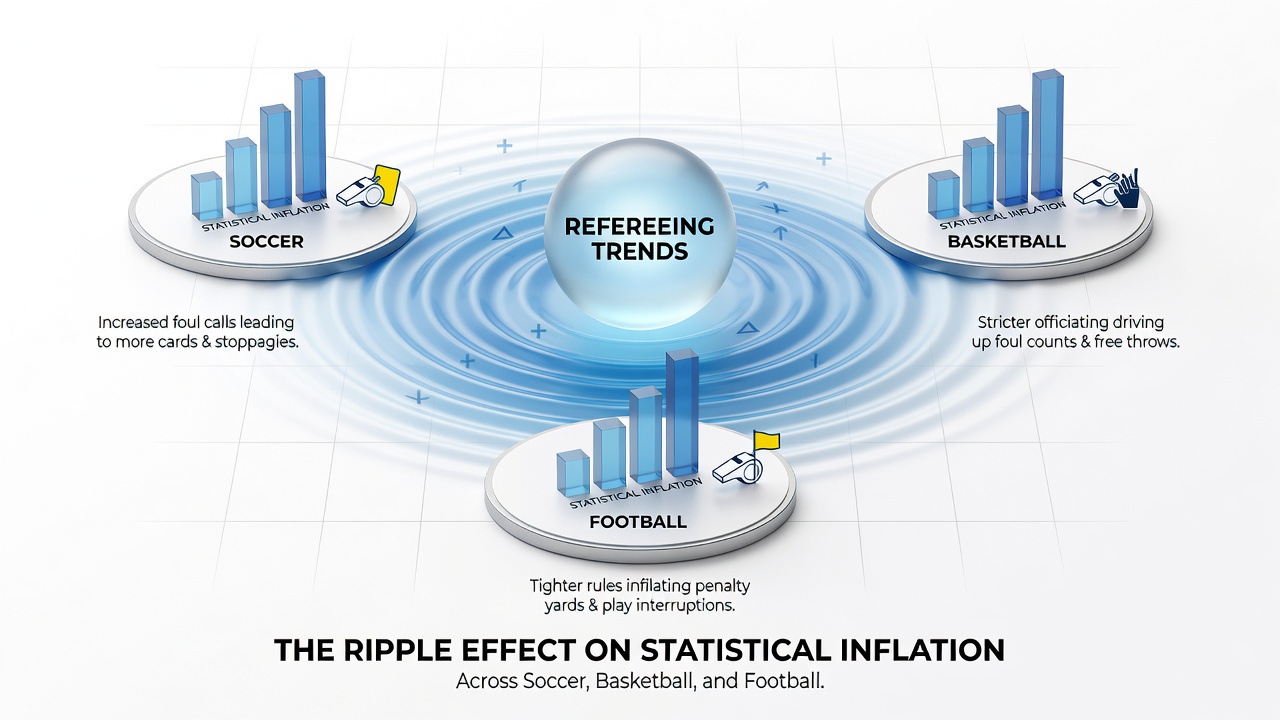
College football conferences adopted comparable targeting and chop-block enforcement, and conference standings from the 2025 season indicate elevated total offense numbers in leagues where officials issued more flags per game. The resulting statistical inflation appears in quarterback rating formulas and team rushing yards, because prolonged possessions compound yardage accumulation across a 12- or 13-game schedule.
Baseball Strike Zone and Walk Rate Shifts
MLB umpires incorporated automated ball-strike systems in select spring training and minor-league environments starting in 2024, and major-league walk rates climbed in subsequent seasons as borderline pitches received more consistent treatment. Pitcher walk totals and on-base percentages for hitters increased accordingly, which in turn affected earned run averages and slugging figures across both leagues. Data from the 2025 and early 2026 seasons shows that games with expanded strike zone reviews featured longer at-bats and higher pitch counts per starter, which shortened outings and increased bullpen appearances.
Position player statistics such as OPS and wRC+ reflect these enforcement patterns because additional baserunners create scoring opportunities that compound across a 162-game season. American League and National League aggregates demonstrate parallel movements, indicating the trend operates independently of designated hitter rules.
Cross-League Data Comparisons Through 2026
Analytics platforms that aggregate multi-sport data sets reveal that referee-driven stoppage increases in soccer and basketball produce comparable extensions in game length to penalty yardage gains in football and walk accumulation in baseball. A study released by the University of Michigan's sports analytics center in early 2026 documented correlations between officiating intervention frequency and offensive output metrics across the four leagues, noting that technology-assisted reviews account for a measurable portion of the observed statistical growth since 2019.
Seasonal leaderboards in August 2026 continue to display elevated benchmarks compared with pre-2020 norms, and team executives cite these referee-influenced environments when evaluating player contracts and roster construction. The cumulative effect appears in both individual awards voting and historical record comparisons, because raw totals now incorporate the downstream consequences of enforcement shifts.
Conclusion
Refereeing trends across soccer, basketball, football, and baseball have produced documented changes in core statistical categories that affect how performance is measured and compared. Continued monitoring of enforcement protocols and technology integration will determine whether these patterns stabilize or accelerate in future seasons.