Regional Climate Patterns and Their Influence on Seasonal Statistical Dominance in Outdoor Team Sports
Cameron Otto · Jun 12, 2026
Regional Climate Patterns and Their Influence on Seasonal Statistical Dominance in Outdoor Team Sports
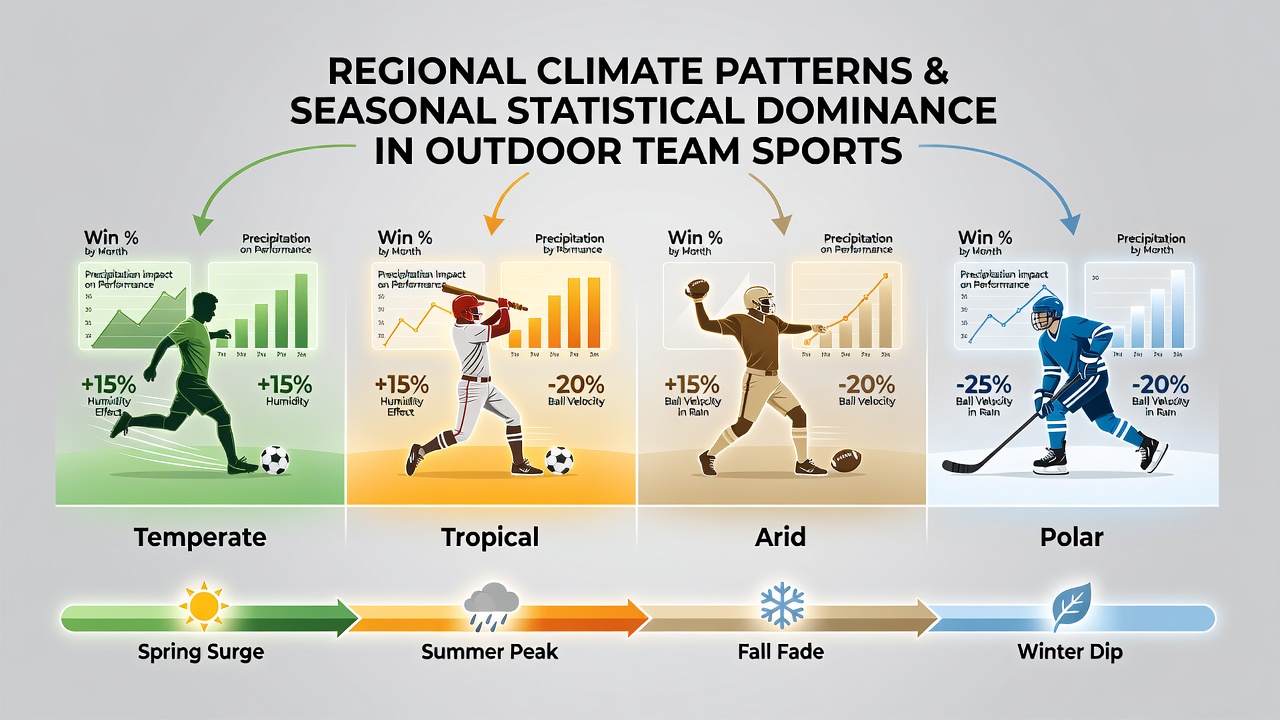
Regional climate patterns shape how athletes perform across outdoor team sports, and the resulting statistical outcomes often reflect those environmental conditions more than raw talent alone might suggest. Data from various leagues shows consistent trends where temperature ranges, precipitation levels, and humidity interact with game schedules to favor certain player types or teams in specific zones. Observers tracking MLB, NFL, and international soccer leagues note that summer months bring measurable shifts in batting averages, passing efficiency, and goal-scoring rates depending on the host region's typical weather profile.
North American Climate Zones and League Statistics
Across the United States and Canada, distinct climate belts create measurable differences in seasonal outputs for baseball and gridiron football. Southern MLB parks experience extended periods above 30 degrees Celsius during June through August, and records compiled through 2025 indicate lower on-base percentages for visiting teams during day games in those venues compared with northern stadiums. In contrast, Canadian Football League and NFL teams in northern markets encounter earlier autumn temperature drops that correlate with reduced completion percentages on longer routes once averages fall below 10 degrees Celsius. Researchers examining decades of box scores find that running back yardage totals tend to rise in cooler, drier conditions typical of the Midwest during late fall, while passing volume expands in the more temperate Pacific Northwest.
European Weather Influences on Soccer Metrics
Western European soccer leagues operate under maritime climates marked by frequent rainfall and moderate temperatures year-round, and statistical reviews of the Premier League and Bundesliga reveal higher pass-completion rates in matches played under 15 degrees Celsius with light precipitation. Southern European competitions face hotter, drier summers that align with dips in high-intensity running distances during August and September fixtures. Data collected by national meteorological services shows these patterns hold across multiple seasons, with set-piece conversion rates increasing in wetter northern venues while open-play goals remain steadier in the Mediterranean region.
Asia-Pacific Patterns and Emerging Data
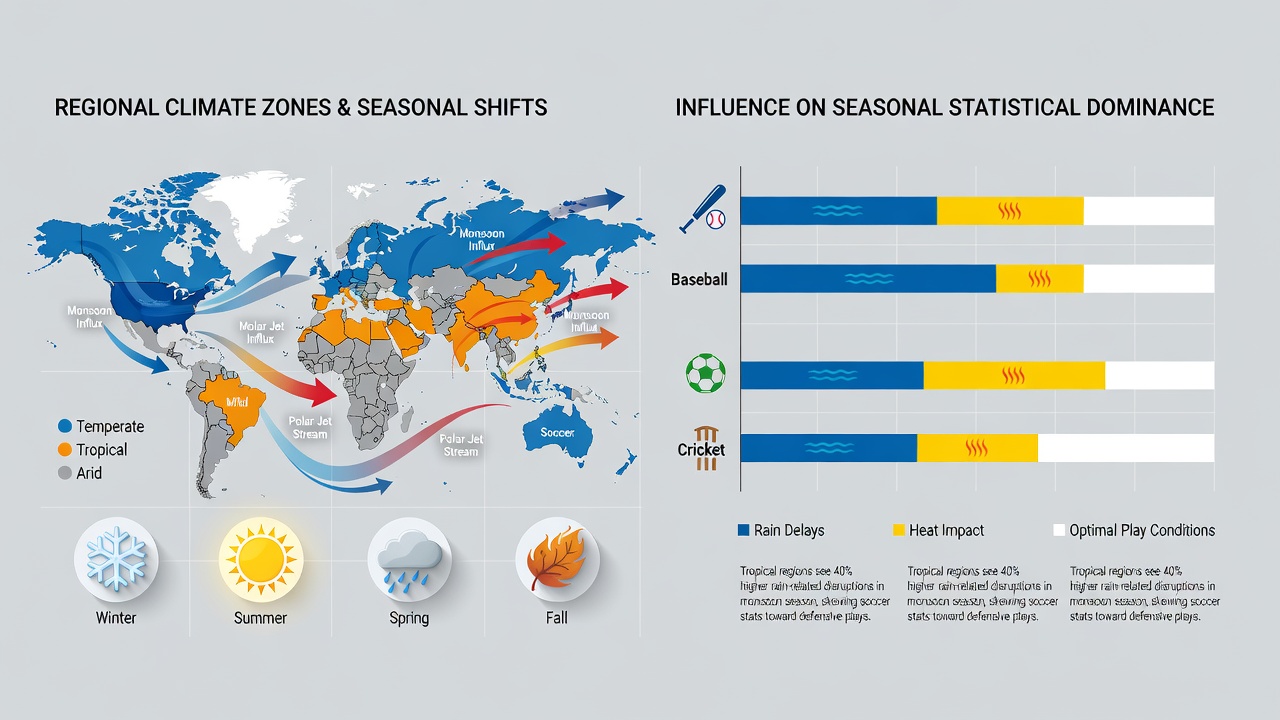
Australian and Japanese professional leagues provide additional case studies where seasonal heat and monsoon cycles alter dominance patterns. Australian Football League clubs in tropical northern states record elevated disposal counts during evening matches once humidity exceeds 70 percent, according to league tracking systems. In Nippon Professional Baseball, Pacific League teams situated in coastal zones show elevated home-run rates during the cooler spring months before typhoon season arrives. These regional signatures appear in aggregated player statistics released each year, allowing analysts to adjust projections based on venue climate history rather than uniform league averages.
Measurement Approaches and Data Integration
League statisticians and climate researchers now combine environmental sensors with traditional box-score metrics to isolate weather effects. The National Oceanic and Atmospheric Administration maintains archives that sports data firms cross-reference with game logs, revealing correlations between dew-point levels and error rates in baseball outfields. Similar collaborations in Europe draw on Met Office records to map how wind patterns influence long-ball success in soccer. These combined datasets allow teams to identify which statistical categories become more or less predictive under specific regional conditions without relying on anecdotal observation alone.
Seasonal Timing and 2026 Observations
By June 2026, MLB and several European soccer leagues will again enter peak summer schedules, and early returns from stadium monitoring stations already show familiar regional divergences in scoring and efficiency numbers. Northern venues continue to post steadier walk rates and lower strikeout totals, while southern and western parks register elevated stolen-base attempts during twilight games when temperatures moderate. Analysts expect these patterns to persist unless scheduling bodies alter start times or venue usage in response to long-term climate trends documented in government reports.
Conclusion
Regional climate patterns leave clear fingerprints on seasonal leaderboards across outdoor team sports because temperature, moisture, and wind interact directly with the physical demands of each game. Organizations that track both environmental and performance data gain clearer insight into why certain statistical categories rise or fall depending on geography and time of year. Continued integration of meteorological records with league statistics will likely sharpen these understandings further as datasets grow more granular.