How Venue-Specific Dimensions Recalibrate Achievement Thresholds Across Diamond, Gridiron, and Pitch Competitions
Erik Koch · Aug 26, 2026
How Venue-Specific Dimensions Recalibrate Achievement Thresholds Across Diamond, Gridiron, and Pitch Competitions
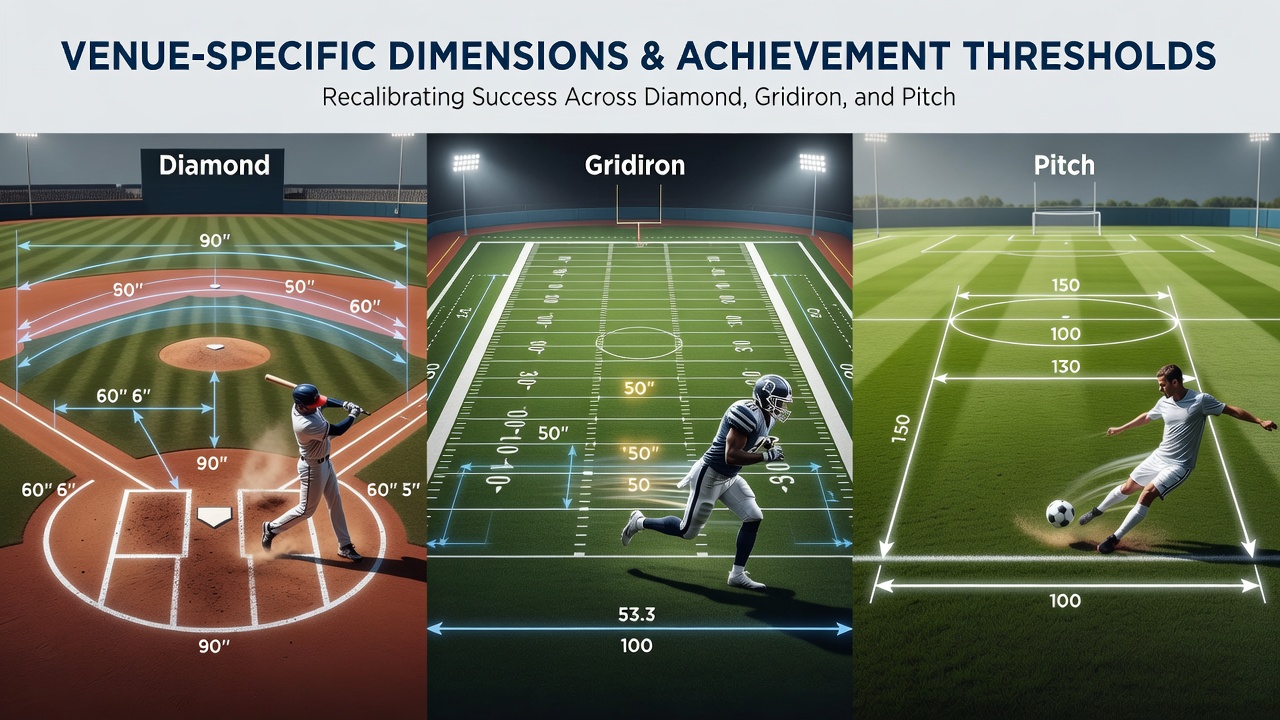
Venue dimensions shape statistical benchmarks in baseball, American football, and soccer because each sport operates within fixed yet variable spatial frameworks that alter scoring rates, player workloads, and record viability. Data from league tracking systems demonstrate consistent patterns where outfield fences, field lengths, and pitch boundaries modify expected outputs without changing core rules.
Baseball Diamond Variations and Offensive Recalibration
Ballparks in Major League Baseball maintain unique wall distances and altitudes that directly influence home run totals and batting average thresholds. Coors Field in Denver sits at 5,280 feet elevation while Fenway Park features a 310-foot left field line, and these differences produce park factors that adjust raw statistics before cross-venue comparisons occur. Research compiled by Baseball Reference shows teams playing half their schedule at Coors Field record home run rates 40 percent above league average, whereas clubs at Oracle Park in San Francisco post figures 15 percent below average due to deeper center field measurements exceeding 420 feet. Observers tracking August 2026 spring training data note that front offices already incorporate these constants when projecting free agent production because raw totals from one venue rarely translate directly to another.
Gridiron Field Standards and Spatial Constraints
American football fields adhere to standardized 100-yard lengths plus end zones, yet stadium configurations introduce secondary variables through wind patterns, roof structures, and sideline proximity that affect passing efficiency and rushing yardage accumulation. Indoor venues such as the Caesars Superdome eliminate weather interference while open-air facilities in Green Bay expose players to cold temperatures that correlate with lower completion percentages according to NFL Next Gen Stats. Studies from Canadian university researchers examining outdoor versus retractable-roof environments indicate rushing attempts gain an average of 0.8 yards per carry in controlled indoor settings because footing remains consistent. Gridiron achievement thresholds therefore incorporate venue adjustments that normalize production across climates rather than treating every 100-yard performance as equivalent.
Soccer Pitch Boundaries and Tactical Adjustments
Soccer pitches range from 100 to 110 meters in length and 64 to 75 meters in width under FIFA guidelines, creating measurable differences in distance covered, pass completion rates, and goal-scoring frequency. Wider surfaces allow fullbacks to maintain higher average positions while narrower pitches compress central midfield space and elevate tackle counts per match. Data released by UEFA technical reports reveal that clubs competing on pitches exceeding 105 meters in length record 12 percent more progressive passes per 90 minutes compared with teams on minimum-width surfaces. In August 2026, European leagues begin incorporating GPS-derived pitch maps into pre-season planning because player workload models must account for teh extra meters traversed on larger fields during high-pressing systems.
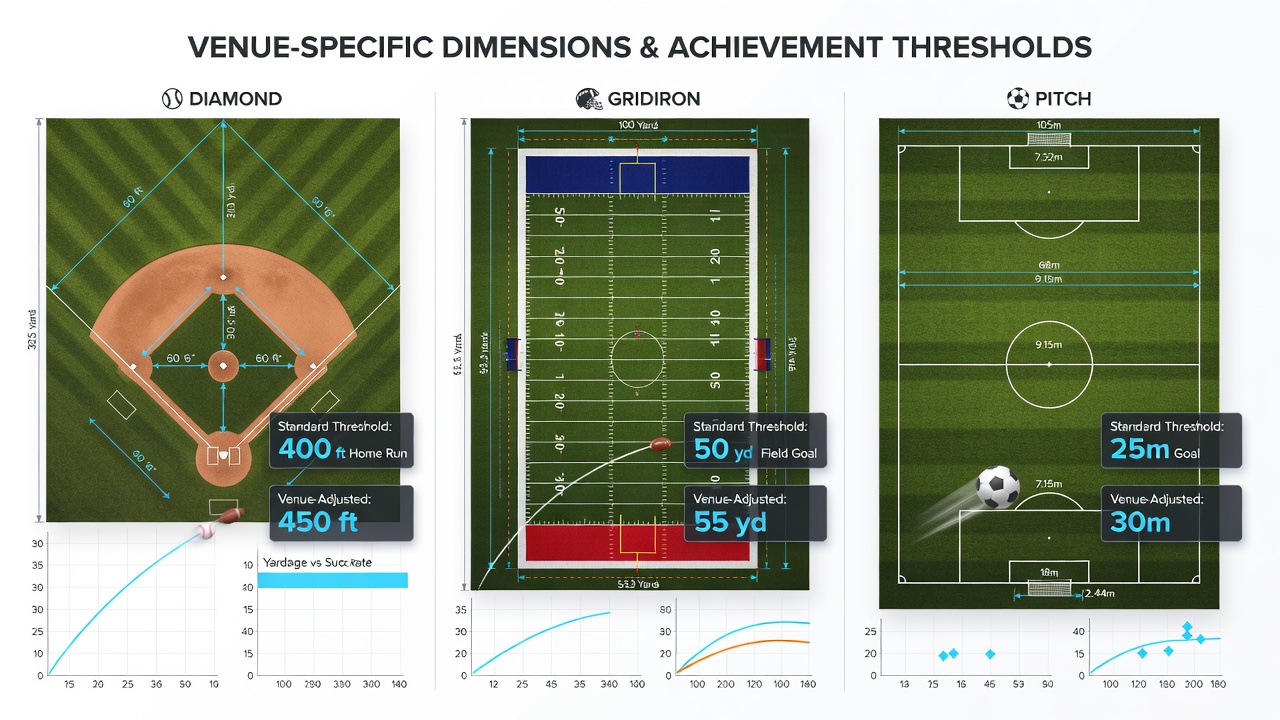
Those who analyze elite match files observe that strikers on expansive pitches accumulate higher expected goal values because defensive lines stretch horizontally, opening lanes that narrower venues naturally close. League tables therefore embed venue coefficients when evaluating forwards across different competitions.
Cross-Sport Threshold Comparisons
Comparative analyses across the three disciplines show that venue adjustments follow similar principles even though measurement units differ. Baseball applies park factors to home run and on-base percentages, football incorporates stadium-specific completion adjustments, and soccer normalizes distance and pass metrics by pitch area. A joint study conducted by researchers at the University of Queensland found that athletes moving between venues experience an average 8 to 14 percent shift in key output metrics within the first five matches, underscoring the need for location-aware evaluation frameworks. These recalibrations prevent overvaluation of production recorded in favorable dimensions and undervaluation of equivalent effort in restrictive ones.
Conclusion
Venue-specific dimensions establish distinct baselines that governing bodies and analysts apply when interpreting seasonal leaderboards. Baseball park factors, football stadium adjustments, and soccer pitch coefficients each function as standardized modifiers that preserve statistical integrity across heterogeneous environments. As data collection expands in August 2026 and beyond, these recalibration methods continue to refine how achievement thresholds are defined and compared.