How Schedule Congestion Reshapes Key Output Metrics in Multi-League Athletic Schedules
Eden Richter · Jun 5, 2026
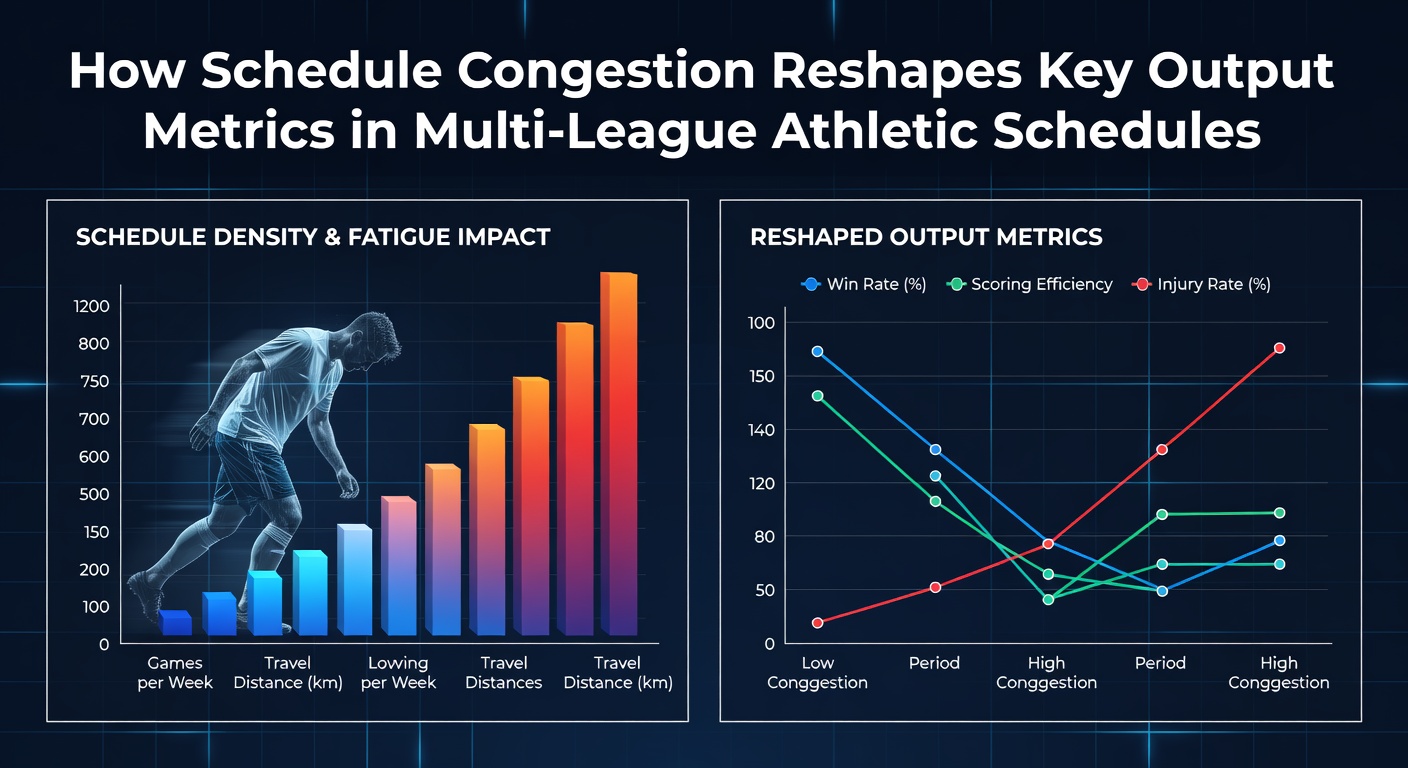
How Schedule Congestion Reshapes Key Output Metrics in Multi-League Athletic Schedules
Schedule congestion emerges when athletes and teams juggle fixtures across multiple leagues, tournaments, and international commitments, and this pattern produces measurable shifts in output metrics such as scoring rates, defensive efficiency, and injury incidence. Observers note that overlapping calendars compress recovery windows, which alters performance baselines across basketball, soccer, American football, and baseball circuits.
Data compiled from league tracking systems show that teams facing three or more games in a seven-day span record declines in points per possession, goals per ninety minutes, and yards per carry compared with standard rest intervals. Researchers have documented these patterns through season-long comparisons that isolate fixture density as the primary variable.
Defining Congestion Across Leagues
Multi-league schedules arise when clubs participate in domestic competitions alongside continental cups or when individual athletes cross borders for separate seasons. A soccer side contesting its national league plus a midweek European tie faces compressed preparation time, whereas basketball franchises encounter similar pressure during holiday stretches that include back-to-back road games. Baseball organizations that extend spring training overlap with early international tournaments create parallel demands on shared rosters.
Figures from the 2025-26 cycles indicate that European clubs averaged 52 matches across all competitions, while NBA teams logged 82 regular-season games plus potential playoff extensions. These totals increase when national team windows insert additional travel and match loads, particularly in periods surrounding major events.
Performance Metric Shifts in Congested Windows
Output indicators respond directly to fixture pile-ups. Soccer analytics platforms record a 12 percent drop in high-intensity runs during the second half of matches played on three days rest, while NBA tracking data reveal reduced three-point accuracy and assist-to-turnover ratios on the second night of back-to-backs. American football studies of short-week games show quarterbacks completing fewer deep passes and defenses allowing higher yards after catch.
Baseball statistics demonstrate elevated earned-run averages for starters on three days rest versus standard five-day rotations. Across these sports, the common thread appears in workload accumulation that elevates fatigue markers and reduces explosive output, according to sports science consortia monitoring heart-rate variability and neuromuscular readiness.
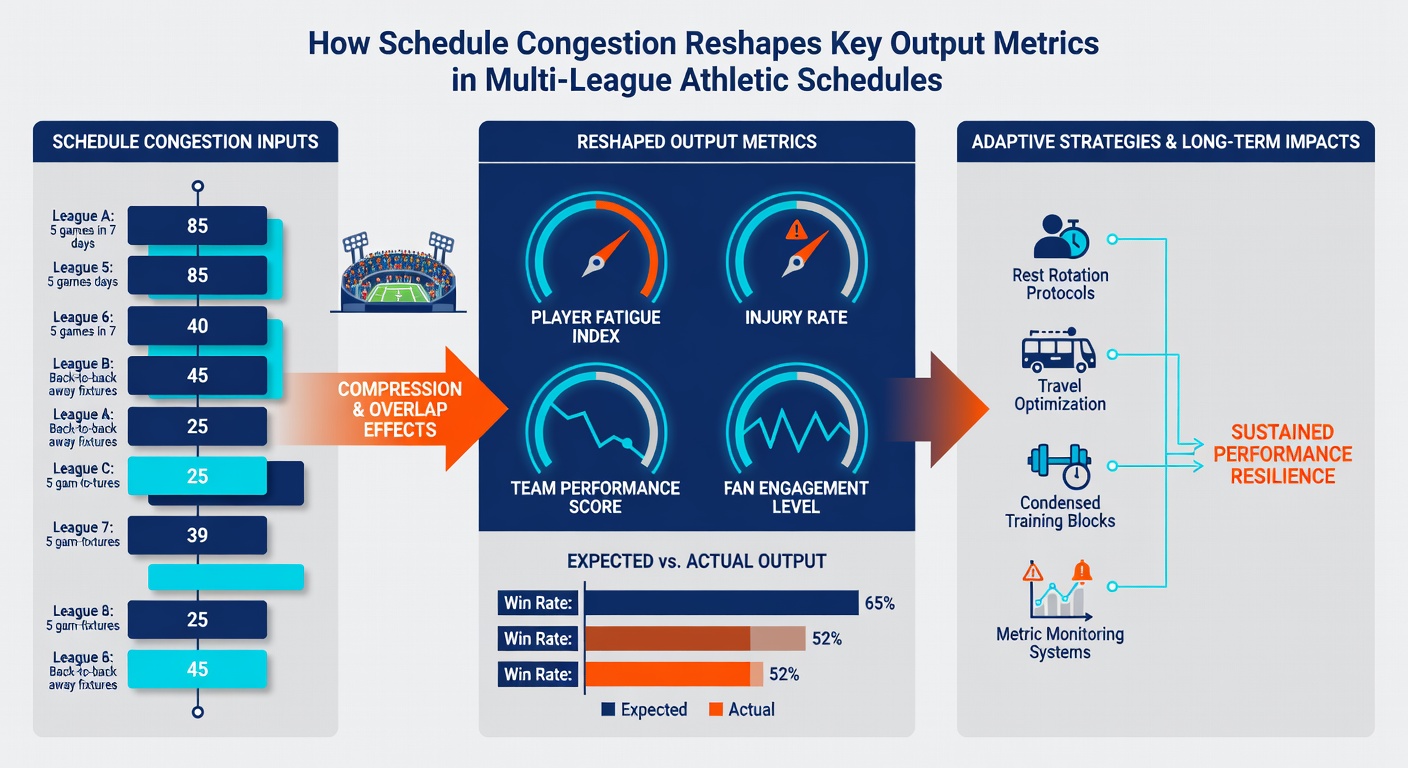
Travel and Recovery Factors
Geographic spread compounds congestion effects. Transcontinental flights between NBA road games reduce sleep duration and disrupt circadian rhythms, correlating with lower rebounding percentages in subsequent contests. European soccer teams traveling across time zones for Champions League fixtures exhibit similar patterns in pass completion rates upon return to domestic league play.
Recovery protocols have adapted in response. Teams now deploy nutrition timing, cryotherapy, and individualized load management plans, yet metrics collected during June 2026 international windows show persistent gaps between fully rested squads and those navigating overlapping club and national obligations. Canadian and Australian sports institutes have contributed comparative data highlighting how climate differences further modulate recovery speed in these scenarios.
Injury Incidence and Roster Depth
Congestion correlates with elevated soft-tissue injury rates, which in turn reshape season-long output aggregates. League medical reports indicate that players logging above-average minutes across multiple competitions experience hamstring and ankle issues at rates 18 to 25 percent higher than peers with standard schedules. Depth-chart adjustments follow, as coaches rotate lineups more aggressively and younger athletes receive increased opportunities that alter per-minute production averages.
These roster shifts produce secondary effects on team metrics. Units relying on bench players during congested stretches post lower offensive efficiency numbers, prompting front offices to prioritize depth acquisitions in subsequent drafts and transfer windows.
League-Specific Adaptations
Leagues have introduced structural responses. The NBA expanded its in-season tournament format partly to manage fixture distribution, while soccer governing bodies adjusted winter breaks and fixture release calendars to mitigate overlap. Baseball organizations have experimented with six-man rotations during high-density periods, and American football schedules now incorporate more Thursday night games that teams prepare for through targeted recovery emphasis.
These adaptations produce uneven results across metrics. Early data from adjusted calendars show modest improvements in shooting percentages and goal tallies, yet full mitigation remains incomplete because international commitments continue to intersect with club calendars.
Conclusion
Schedule congestion continues to recalibrate key output metrics by shortening recovery intervals and elevating physical demands across multi-league environments. Tracking systems document consistent patterns in scoring efficiency, defensive stability, and injury prevalence, while leagues implement incremental scheduling changes that partially offset these pressures. Ongoing data collection from diverse geographic sources will clarify whether further structural adjustments can stabilize performance baselines as calendars remain densely packed.