Echoes of Rule Tweaks: How Minor Regulation Shifts Have Reshaped Scoring Patterns Across Decades in Gridiron, Hardwood, Diamond, and Pitch Leagues
Erik Koch · Aug 7, 2026
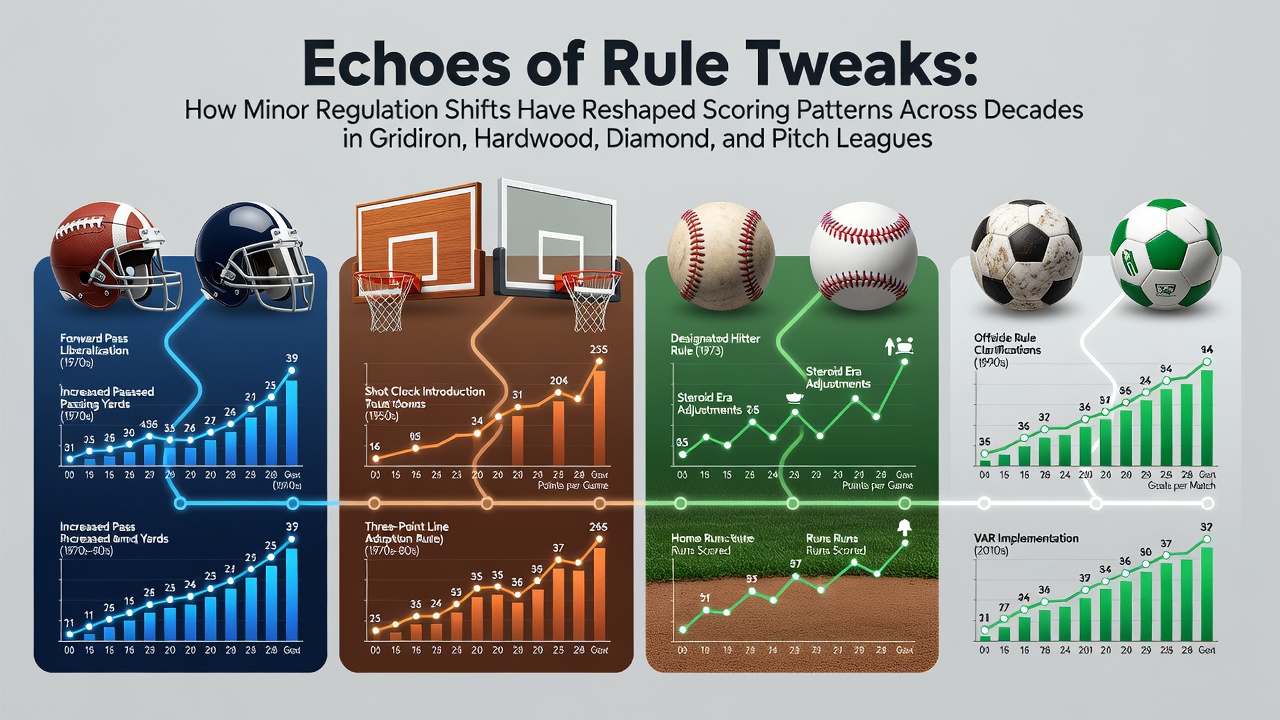
Echoes of Rule Tweaks: How Minor Regulation Shifts Have Reshaped Scoring Patterns Across Decades in Gridiron, Hardwood, Diamond, and Pitch Leagues
Rule adjustments in professional sports often arrive without fanfare yet they recalibrate scoring outputs across entire eras, and observers tracking gridiron, hardwood, diamond, and pitch competitions have documented these ripple effects through league archives and statistical databases since the mid-twentieth century. Small modifications to field dimensions, defensive restrictions, or restart procedures produce measurable shifts in points, runs, and goals that accumulate over decades rather than overnight. Researchers examining NFL, NBA, MLB, and soccer records note that these tweaks interact with player skill sets, training methods, and equipment changes, which complicates direct attribution yet still reveals consistent patterns when data spans multiple seasons.
Gridiron Adjustments and Passing Volume
NFL officials moved the hash marks closer to the center of the field in 1972, a decision that expanded passing lanes and reduced the advantage long-field goals once provided to conservative offenses. Scoring averages climbed from 20.8 points per team per game in the 1971 season to 22.4 by 1975 according to official league ledgers, while completion percentages rose steadily as quarterbacks faced fewer sideline constraints. Later restrictions on defensive contact with receivers, introduced in phases during the 1970s and reinforced in 2004 with the illegal contact rule, further tilted balance toward aerial attacks. Data compiled by league statisticians shows passing yards per game increased from 178 in 2003 to 229 by 2013, with touchdown passes following a similar upward trajectory. These incremental changes did not overhaul the rulebook in one stroke but they compounded across coaching schemes and personnel decisions that prioritized wide receivers and tight ends in modern alignments.
Hardwood Evolution Through Perimeter Emphasis
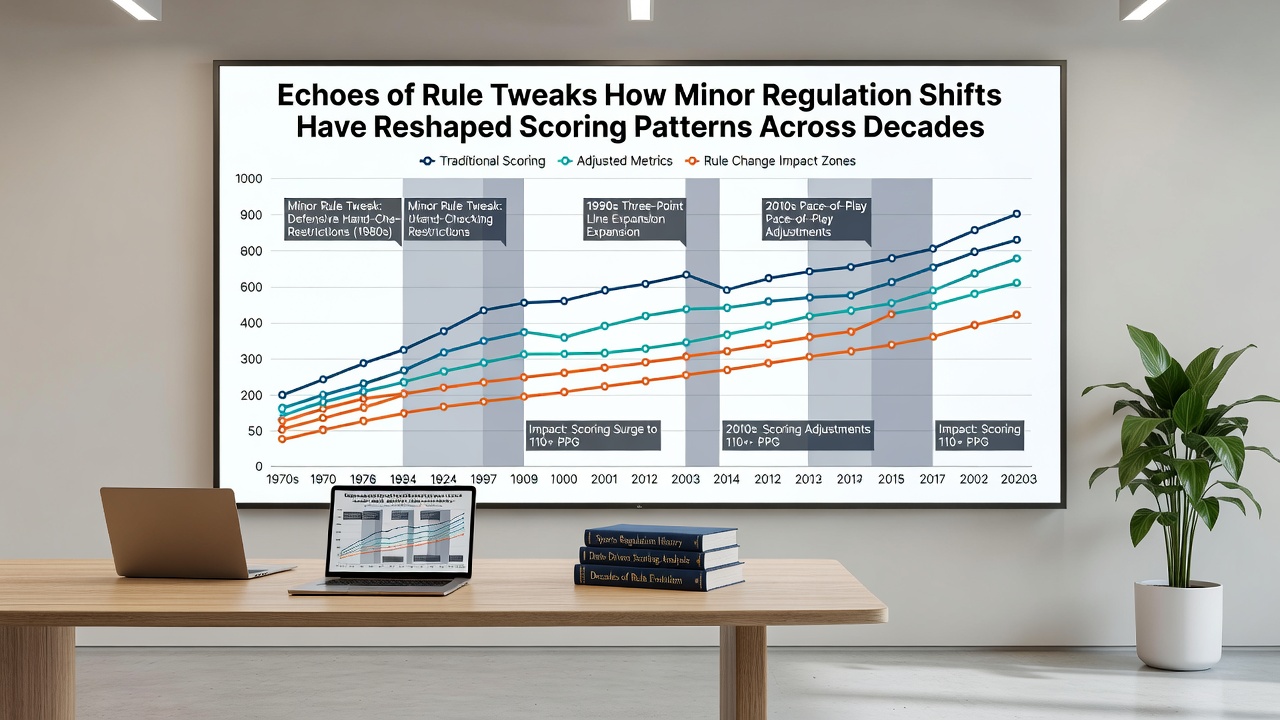
The NBA introduced the three-point line for the 1979-80 season at a distance of 23 feet 9 inches, a measurement that initially produced modest usage yet eventually transformed offensive spacing once coaches adapted their systems. League-wide scoring jumped from 108.5 points per team per game in 1978-79 to 110.4 the following year, with the volume of three-point attempts growing from fewer than three per team to more than thirty by the 2018-19 campaign. A separate 2004 rule change that limited hand-checking on perimeter players reduced physical disruption for ball handlers and coincided with another scoring spike that reached 110.4 points per game by 2016-17. Analysts reviewing play-by-play logs note that these modifications encouraged positionless lineups where multiple shooters operate beyond the arc, while defensive schemes evolved to contest shots at greater distances rather than funneling drivers into the paint.
Diamond Modifications Affecting Run Production
MLB implemented the designated hitter rule in the American League starting in 1973, removing pitchers from the batting order and replacing them with specialized hitters whose on-base and slugging percentages exceeded those of typical hurlers. Run totals per game in the AL rose from 3.9 in 1972 to 4.4 by 1974 while the National League, which retained pitchers batting, maintained lower outputs until the universal DH arrived in 2022. The 2023 ban on defensive shifts further altered batted-ball outcomes, with batting averages on balls in play increasing by several points league-wide according to Statcast tracking data released by MLB. Pitch-clock enforcement that same year shortened average game times yet also compressed preparation windows for hitters, producing mixed early effects on home-run rates that stabilized around 1.2 per team per game by the 2025 season. These layered adjustments demonstrate how equipment-neutral changes in positioning and timing can redistribute run-scoring opportunities without altering ball or bat specifications.
Pitch Regulations and Goal Flow
Soccer governing bodies enacted the back-pass prohibition in 1992 to curb time-wasting by goalkeepers who previously handled passes from teammates, a restriction that forced quicker distribution and raised average goals per game from 2.62 in 1990-91 to 2.82 by 1992-93 across top European leagues tracked by UEFA records. Subsequent introductions of video assistant referee protocols, rolled out progressively from 2018 onward, added scrutiny to offside and penalty decisions that increased awarded spot kicks in several competitions while also trimming marginal goals from tight calls. FIFA competition reports indicate that goal tallies in World Cup matches fluctuated modestly after each procedural refinement, with the 2022 tournament averaging 2.8 goals per match compared with 2.7 in 2014. These modifications interact with tactical formations that emphasize build-up play from the back, creating sustained pressure that elevates scoring without requiring wholesale overhauls to field size or match length.
Cross-League Patterns and Cumulative Effects
Observers comparing longitudinal datasets across the four sports identify common threads where defensive limitations or spacing enhancements reliably precede scoring increases that plateau once strategies adapt. August 2026 league meetings in each sport are scheduled to review similar incremental proposals, including potential adjustments to overtime procedures in the NFL and foul accumulation rules in the NBA, though implementation timelines remain subject to competition committee votes. Studies published by academic sports science departments, such as those affiliated with the University of Michigan's research consortium, emphasize that rule changes rarely operate in isolation because player development pipelines and analytics departments respond rapidly to new constraints. The resulting scoring environments reflect decades of layered decisions rather than single transformative events, which explains why contemporary leaderboards display elevated outputs compared with mid-century benchmarks even when raw athleticism metrics remain comparable.
Conclusion
Minor regulatory shifts continue to echo through scoring patterns because they alter the cost-benefit calculations that coaches and players apply across thousands of possessions each season. Gridiron passing explosions, hardwood perimeter proliferation, diamond run redistribution, and pitch goal increments all trace back to targeted interventions that accumulated measurable effects without disrupting core game identities. Data maintained by league offices and independent research groups shows these trends persisting into the present, with future adjustments likely to follow the same pattern of gradual recalibration rather than abrupt reinvention.