Contextual Overlays: How Supporting Cast Quality and Schedule Difficulty Recalibrate Individual Statistical Dominance Across NFL, NBA, Soccer, and MLB Seasons
Cameron Otto · Jul 15, 2026
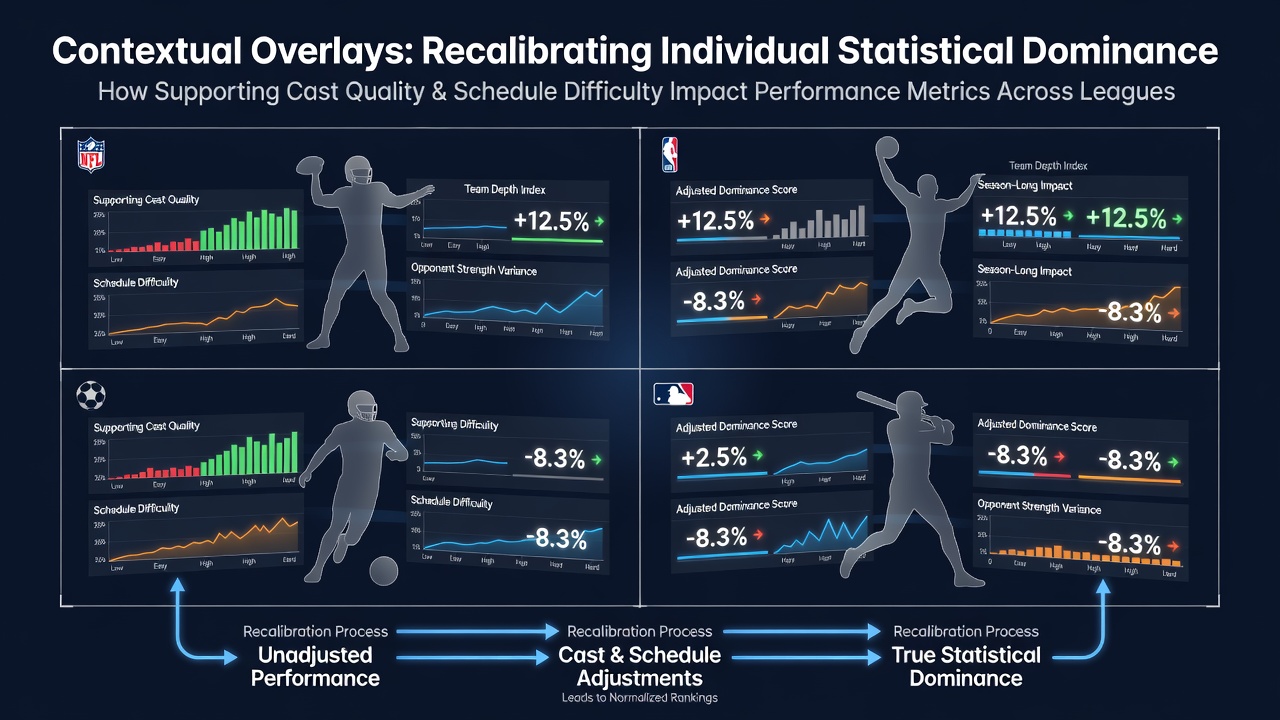
Contextual Overlays: How Supporting Cast Quality and Schedule Difficulty Recalibrate Individual Statistical Dominance Across NFL, NBA, Soccer, and MLB Seasons
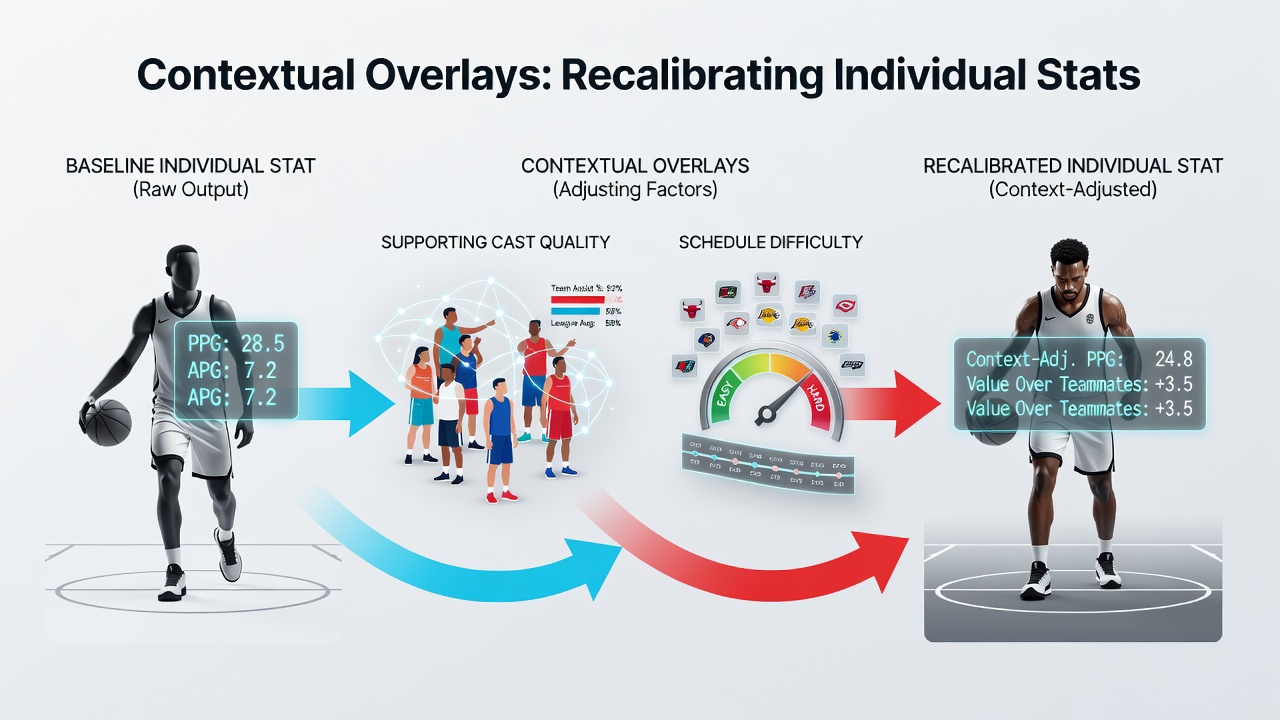
Analysts across professional sports track how raw statistical outputs shift when adjusted for teammate contributions and opposing schedule strength, and researchers continue to refine these contextual models in the lead-up to July 2026. Data from multiple leagues demonstrates that individual dominance often expands or contracts based on surrounding personnel and fixture difficulty rather than isolated talent alone.
Adjustments in the NFL
Quarterback passing yards and completion rates frequently align with offensive line stability and wide receiver separation ability, while strength-of-schedule metrics from the previous five seasons reveal that passers facing top-10 defenses post lower adjusted efficiency numbers even when volume remains high. Running backs on teams with elite blocking schemes accumulate more yards after contact according to Next Gen Stats tracking, whereas those behind weaker units see their per-carry averages drop despite similar workloads. Defensive players likewise post sack totals that correlate with front-seven rotation depth, and observers note that edge rushers on squads with strong interior pressure generate higher pressures per snap when the schedule includes fewer mobile quarterbacks.
Recalibrations Across the NBA
Scoring leaders in the NBA often see their points-per-game figures recalibrated once usage rate and teammate spacing receive equal weight, with studies from the league's analytics department showing that high-volume shooters on teams lacking secondary creators experience efficiency declines during stretches against elite defensive schemes. Rebound totals for big men expand when paired with perimeter defenders who force long misses, yet the same players record fewer boards against opponents that control the defensive glass through superior positioning. Assist numbers for point guards rise in lineups featuring multiple three-point threats, and schedule difficulty data from the 2024-2025 campaign indicates that players logging heavy minutes against top defensive teams post lower true shooting percentages even as raw volume stays constant.
Soccer League Patterns
Premier League goal tallies for strikers adjust when midfield creation metrics enter the equation, and figures from Premier League official tracking demonstrate that forwards supported by high-progression passers maintain elevated expected-goal rates despite facing compact defensive blocks. Midfielders accumulate more progressive carries on squads with reliable fullback overlap, whereas those in isolated roles see their key-pass totals compress against opponents who press in coordinated units. Schedule congestion data across European domestic and continental fixtures shows that players logging extra matches record measurable drops in distance covered per 90 minutes, which in turn affects duel-win percentages even when individual skill profiles remain unchanged.
MLB Seasonal Context
Home-run rates for power hitters rise when lineup protection places stronger on-base threats ahead in the order, and MLB Statcast data reveals that sluggers batting behind high-OBP teammates see more fastballs in favorable counts. Pitchers post lower earned-run averages when backed by above-average defensive shifts and range, while the same arms allow more hard contact against lineups stacked with disciplined hitters during stretches of elevated schedule difficulty. Starting pitchers on teams with deep bullpens maintain higher strikeout rates into later innings, and researchers tracking 2025 data found that relievers facing multiple high-leverage appearances in succession exhibit slight velocity dips that correlate with reduced whiff percentages.
Cross-League Comparisons
Comparative models applied across the four major leagues illustrate that supporting-cast adjustments frequently account for 15 to 25 percent of variance in raw leaderboards once schedule strength receives equal weighting. Teams with concentrated talent clusters produce inflated individual outputs that normalize when measured against league-wide baselines, and data from university-led sports analytics programs shows these patterns hold steady from season to season. Players who transition between rosters with differing support levels often experience rapid statistical resets, underscoring how contextual layers reshape perceived dominance without altering underlying skill sets.
Conclusion
Contextual overlays continue to refine how leagues, teams, and media evaluate statistical dominance, and ongoing collection of granular tracking data ensures these adjustments remain central to performance analysis heading into future campaigns.