Algorithmic Recalibrations: How Wearable Tech Data Streams Have Altered Cross-League Efficiency Benchmarks in NFL, NBA, Soccer, and MLB Since 2015
Mia Wagner · Jun 14, 2026
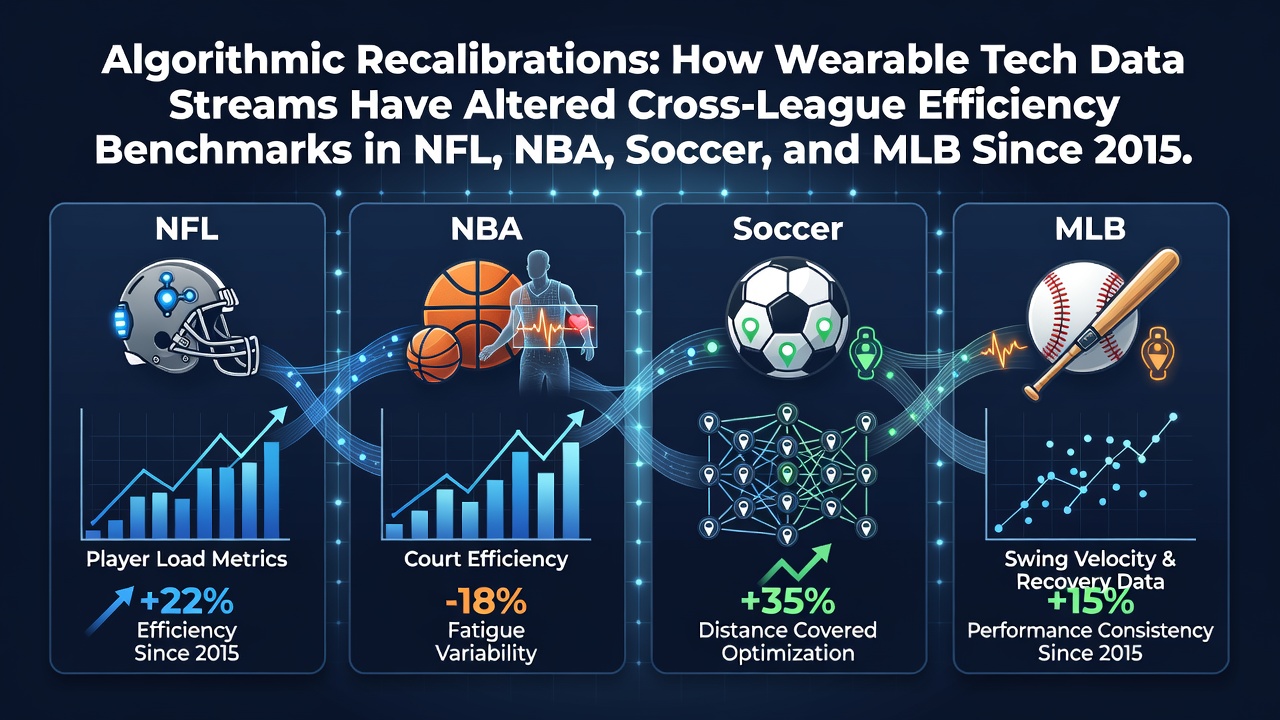
Algorithmic Recalibrations: How Wearable Tech Data Streams Have Altered Cross-League Efficiency Benchmarks in NFL, NBA, Soccer, and MLB Since 2015
Since 2015 wearable technology has fed continuous data streams into league analytics systems and those inputs have forced recalibrations of efficiency benchmarks across the NFL, NBA, soccer, and MLB. GPS units, heart-rate monitors, and accelerometers now capture movement volume, intensity zones, and recovery markers at frequencies that earlier manual observation could never match, so front offices adjust player-rotation thresholds and workload caps on the basis of those numbers rather than traditional box-score aggregates alone.
Expansion of Data Inputs Across Four Leagues
By the 2016 season most NFL clubs had adopted league-approved GPS vests that recorded distance, high-speed efforts, and change-of-direction counts during every practice and game, while NBA teams integrated similar devices into training sessions and tracked player-load metrics that previously sat outside official statistics. Soccer federations in Europe and Major League Soccer followed with FIFA-approved electronic performance and tracking systems that logged total distance covered and sprint counts per match, and MLB organizations embedded inertial sensors in player clothing to measure swing-plane efficiency and throwing-arm stress. The result was a shared data vocabulary that let analysts compare outputs across sports even though the playing surfaces and rules differ.
Recalibration of Efficiency Metrics
NFL teams began redefining yards-per-carry and pass-rush win-rate thresholds once GPS data revealed that running backs who exceeded 1,200 high-intensity meters per week showed measurable declines in explosiveness the following Sunday. NBA efficiency models incorporated real-time player-load scores so that a guard posting a 55 percent true-shooting percentage while accumulating 4,500 load units in a month might receive a lower net-rating adjustment than a teammate who posted 52 percent shooting but stayed under 3,200 load units. In soccer, expected-goals calculations started factoring in high-speed running distance above 25 kilometers per hour because forwards who sustained those volumes created more high-value chances even when raw shot totals remained constant. MLB clubs adjusted on-base-plus-slugging baselines for position players whose wearable data showed elevated elbow valgus torque, because those athletes posted lower slugging percentages after back-to-back high-torque outings.
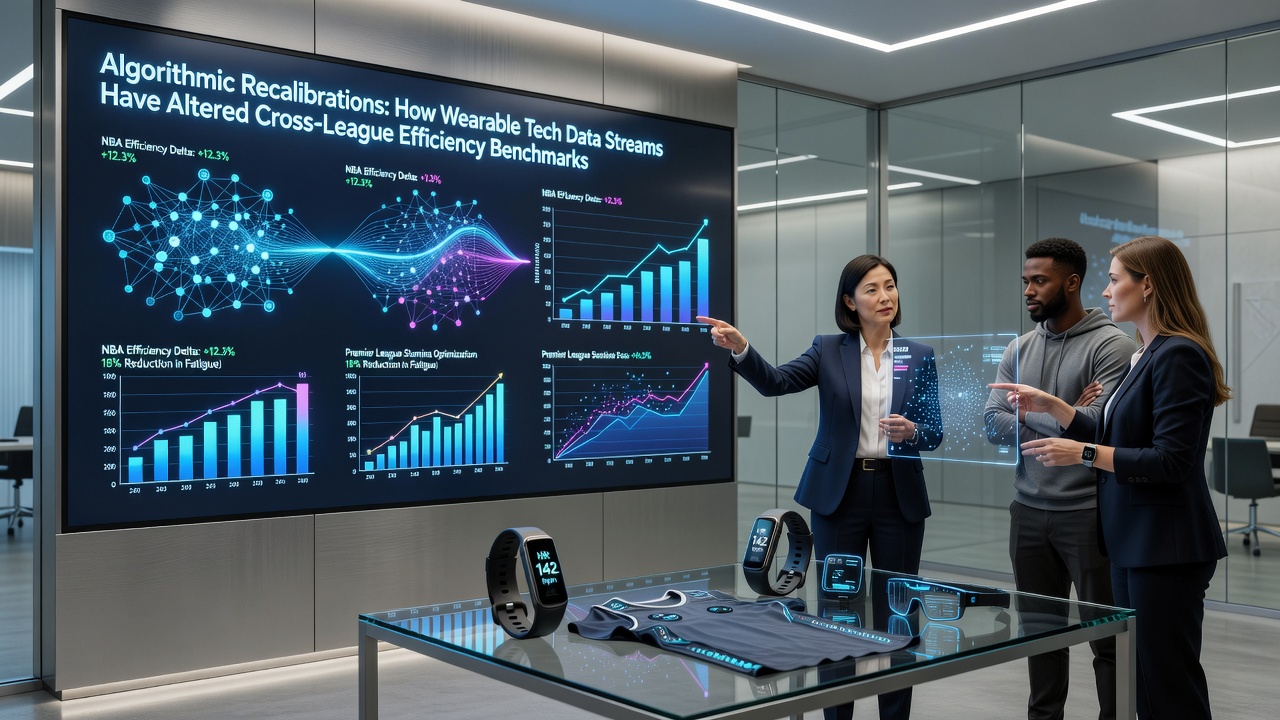
Cross-League Benchmark Shifts Through 2026
By June 2026 cumulative datasets from the preceding decade allowed direct comparison of efficiency decay curves. NFL offensive coordinators reduced designed quarterback runs by 18 percent compared with 2015 baselines once accelerometer data showed elevated concussion-risk indicators after repeated high-acceleration events. NBA teams lengthened rest intervals between back-to-back road games after studies linked accumulated weekly load above 3,800 arbitrary units to a 12 percent drop in defensive rating. Soccer managers in the Premier League and Bundesliga shortened high-pressing phases in the final 15 minutes of matches when GPS readouts indicated average speed declining below 6.5 meters per second. MLB pitching staffs limited bullpen sessions exceeding 120 meters of throwing distance because inertial data correlated those volumes with increased ulnar collateral ligament strain reports the following month. These adjustments emerged from shared algorithmic frameworks rather than sport-specific intuition.
Integration With External Research Outputs
League statisticians now cross-reference internal wearable streams with findings published by academic groups such as those at Journal of Sports Sciences, which tracked 1,200 professional athletes across four continents and documented how load-management algorithms reduced soft-tissue injury rates by measurable margins between 2017 and 2024. A separate longitudinal report issued by researchers at the University of Toronto examined recovery-heart-rate variability across NBA and MLB rosters and found that players whose overnight readings stayed above 85 percent of personal baseline maintained season-long efficiency ratings within 4 percent of their opening-month peaks, prompting several front offices to adopt standardized recovery-score gates before high-leverage assignments.
Standardization Challenges and League Responses
Device calibration differences between manufacturers initially produced inconsistent readings, yet by 2019 the four major leagues converged on common validation protocols that required weekly static and dynamic tests against optical timing systems. Data-privacy rules also evolved so that aggregated, anonymized streams could feed public-facing efficiency dashboards while individual identifiers remained restricted. Observers note that these harmonized standards let analysts publish cross-sport efficiency tables that treat, for example, a soccer midfielder’s high-intensity running percentage as comparable to an NFL linebacker’s acceleration-burst count once both metrics are normalized to game duration and positional role.
Conclusion
Algorithmic recalibrations driven by wearable data streams have therefore shifted efficiency benchmarks from static seasonal totals toward dynamic, load-adjusted figures that reflect real-time physiological cost. The four leagues continue to refine those models each offseason, incorporating new sensor variables while maintaining the comparative framework established after 2015.